Contribute to this page
Historian
The Namespace → Historian page visualizes the time-series you recorded by historizing tags, and exports it to CSV.
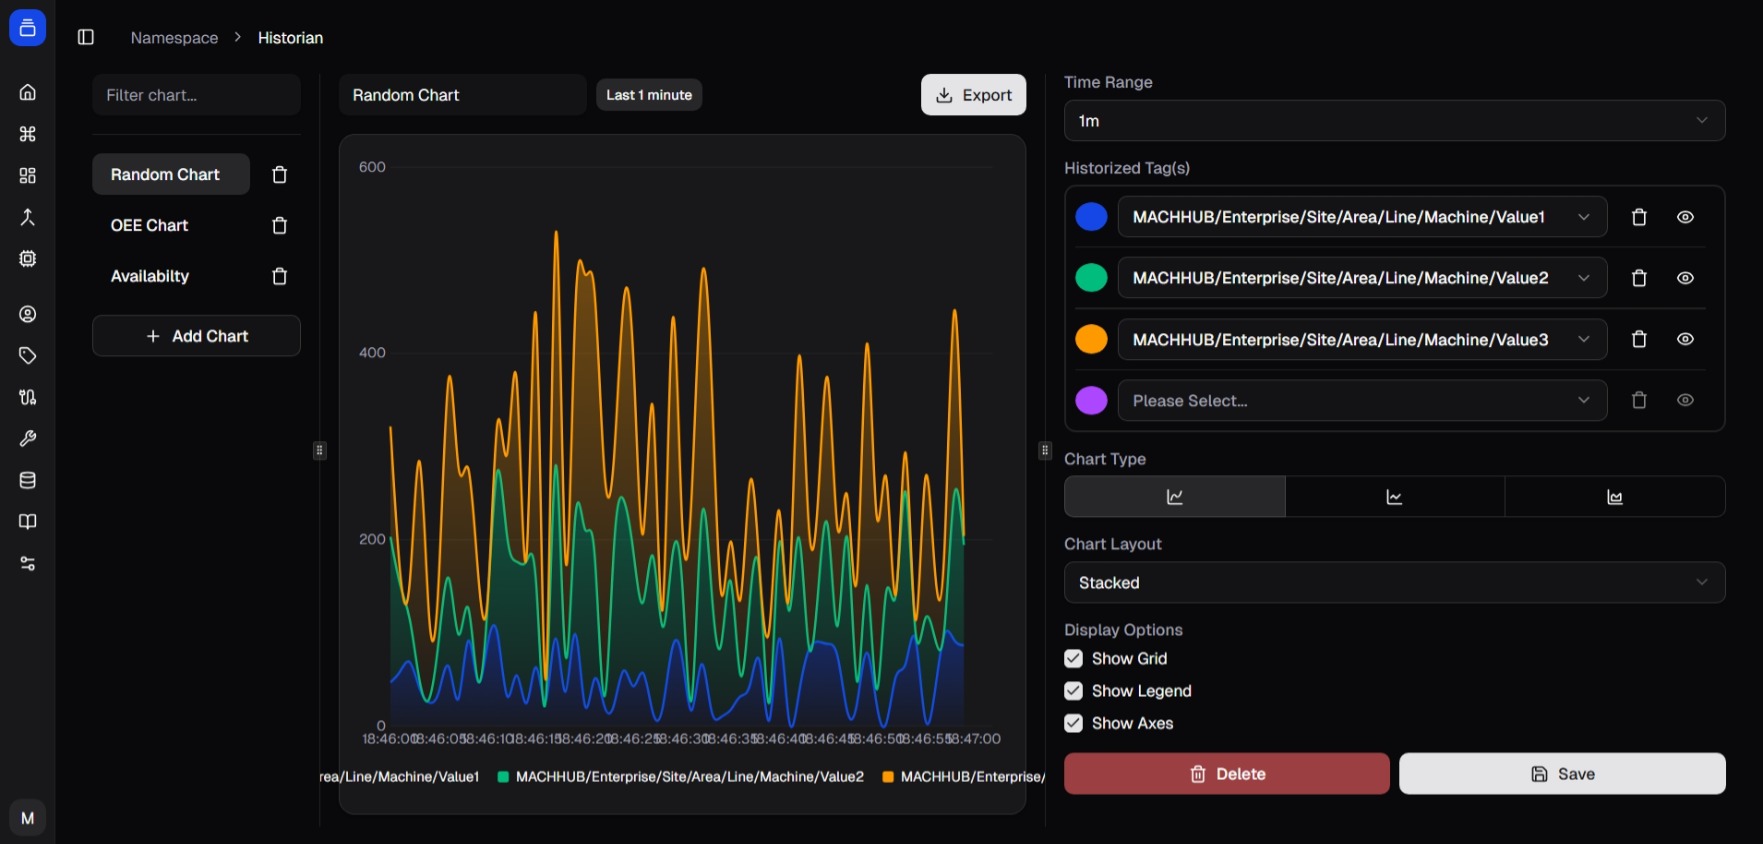
/namespace/historian) — a time-series chart.View a chart
Section titled “View a chart”- Open the Filters panel.
- Pick a Historized Tag.
- Pick a Value Key (the field within the tag’s payload to plot).
- Choose a Time Range (1m, 5m, 15m, 30m, 1h, 3h, 6h, 12h, 1d, 7d, 30d).
The chart renders the selected series and auto-refreshes every few seconds. Non-numeric values fall back to a timestamp/value table.
Export to CSV
Section titled “Export to CSV”- Open the Export dialog.
- Select one or more tags.
- Choose a date range (presets like Today / Last 7 days, or a custom range).
- Export — the console downloads a CSV per tag, showing a per-tag progress bar.

Doing this in code
Section titled “Doing this in code”The same data is available through the SDK — export historized tags as a CSV Blob,
with optional bucketing and aggregation:
const blob = await sdk.historian.getHistoricalDataAsCSV( ['line1/oven/temperature'], startDate, endDate, 'UTC', '1_hour', // bucket interval 'mean' // aggregation);See SDK → Historian and the Historian concept.